

1. Real-time PCR Technique
The invention of the polymerase chain reaction (PCR) by Kary Mullis in 1984 is considered a revolution in science. However, basic PCR only stops at amplifying DNA sequences, which is not enough to meet the increasingly diverse needs in molecular biology research and applications. Real-time PCR technique or quantitative PCR (abbreviated as qPCR) is one of the basic PCR improvements, specifically, in addition to amplifying the target sequence, this technique also quantifies how much target DNA is in the sample thanks to the signal. The emitted fluorescence is recorded by the machine during the reaction.
Real-time PCR is an improved technique from PCR, allowing to monitor the increase and quantification of target DNA in the test sample throughout the time. The actual time the reaction takes place thanks to fluorescence technology.
2. Principles of Real-time PCR technique
Real-time PCR technique is basically still PCR, so the principle is still to use specific primer pairs to detect and amplify the target sequence by changing the temperature periodically. The difference is that real-time PCR is also based on the principle of using probes or fluorescent dyes to indicate the increase in copies of the target sequence, and the amount of signal recorded is measured by the machine over time. perform reaction.
When the replication reaction reaches a certain cycle, the fluorescence signal intensity will begin to increase clearly and correlate with the number of DNA copies created. The results are presented on the computer as a graph observed through each cycle, from which an assessment can be made about the efficiency of target DNA amplification. Real-time PCR requires a device to measure fluorescence intensity from the sample tube and install a software program that allows processing the results of changes in fluorescence intensity.
3. Real-time PCR Cycle
Basically, real-time PCR reaction is similar to PCR, consisting of many consecutive thermal cycling cycles (30-45 cycles), each cycle includes three main steps:
Step 1: Denaturation phase
The temperature will be brought up to 94 – 95 oC for about 5–30 seconds, breaking the hydrogen bonds and denaturing the double-stranded DNA into two single strands.
Step 2: Annealing and extension phase
The temperature is lowered appropriately for the primers to complement the two ends of the target sequence (usually about 55 - 65 oC). In this step, as soon as the primer attaches to the template strand, DNA polymerase will immediately recognize the position and start using free dNTP to extend the 3′-OH end of the primer.
Step 3: Extension
In this step, the temperature is raised to 72oC to optimize the synthesis activity of DNA polymerase. At this time, the reaction time will depend on the target length, usually about 30 seconds. for up to a few minutes.
Thus, after each cycle consisting of three repeated steps, the number of target DNA copies increases exponentially (2ⁿ copies, where n is the number of cycles). Unlike conventional PCR, the quantification of the target DNA is performed during the exponential amplification phase. With each cycle, the increase in fluorescent signal is recorded, corresponding to the number of DNA copies generated. Moreover, Real-time PCR is commonly applied in diagnostic testing, which requires results to be both accurate and rapid.
Therefore, Real-time PCR used in testing usually includes only two denaturation and annealing steps which are sufficient to amplify target sequences <200 bp in length. This helps save time, quickly detect and quantify target DNA in molecular biology diagnostics.
4. Fluorescence mechanism
Based on the binding and fluorescence mechanism, real-time PCR can classify fluorescent molecules into two main groups. The first group consists of fluorescent molecules inserted into double-stranded DNA, while the second group consists of fluorescently labeled probe molecules capable of specifically binding to the generated PCR product.
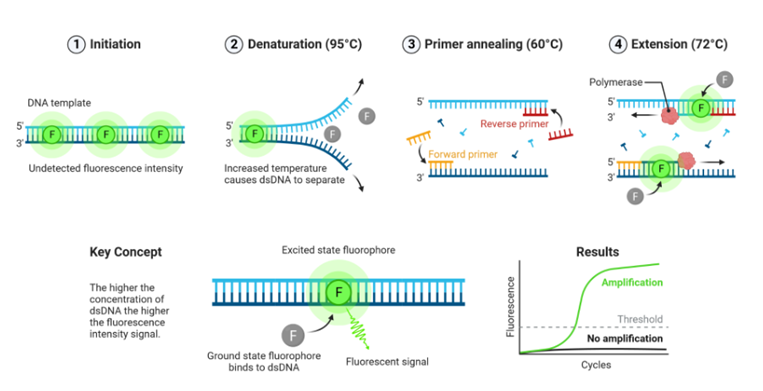
Fluorescent dyes intercalating into double-stranded DNA are compounds that emit significantly higher-intensity fluorescence when bound to DNA (Figure 1). When bound to DNA, these fluorescent dyes form a luminescent complex that emits light at significantly higher intensity compared to their unbound state when excited by light or UV rays. This enables the detection and quantification of DNA presence and concentration in a sample.
The intensity of the fluorescent signal increases proportionally to the amount of DNA present in the sample, enabling accurate and reliable DNA quantification. When unbound, these fluorescent dyes emit light at a lower intensity upon excitation, creating a baseline signal in real-time PCR reactions. Commonly used fluorescent dyes in real-time PCR include SYBR Green, EvaGreen, LC Green, SYTO9, and others.
(https://app.biorender.com)
Fluorescent-labeled probes are oligonucleotides specifically designed to emit fluorescent signals when bound to the target PCR product. Probes such as TaqMan probes, molecular beacons, and Scorpion probes can emit light upon hydrolysis during the PCR process. Among these, the TaqMan probe technology is widely utilized in diagnostic testing due to its reliability and precision.
Taqman probe là đoạn oligonucleotide sợi đơn có thể bắt cặp đặc hiệu với một đoạn trình tự trên DNA mục tiêu, bao gồm đầu 5’ gắn chất phát huỳnh quang (reporter) và đầu 3’ gắn chất hấp phụ huỳnh quang (quencher). Khi cấu trúc của mẫu dò còn nguyên vẹn thì đầu quencher sẽ làm tắt tín hiệu huỳnh quang phát ra từ đầu reporter nếu khoảng cách hai đầu này đủ gần bởi cơ chế FRET (fluorescence resonance energy transfer – truyền năng lượng cộng hưởng). Khi có sự hiện diện của DNA mục tiêu, phản ứng PCR xảy ra và trong quá trình kéo dài, Taq polymerase gặp TaqMan probe sẽ dừng lại và bắt đầu nén, đồng thời hoạt tính 5’-3’ exonuclease thủy giải Taqman probe. Khi TaqMan probe bị thủy giải, reporter được giải phóng khỏi quencher, tạo ra tín hiệu huỳnh quang khi có ánh sáng kích thích. Cường độ tín hiệu huỳnh quang sẽ tăng lên sau mỗi chu kỳ, tương ứng với sự tăng lên của sản phẩm PCR (Figure 2).

(https://app.biorender.com)
5. Basic Concepts in Real-time PCR
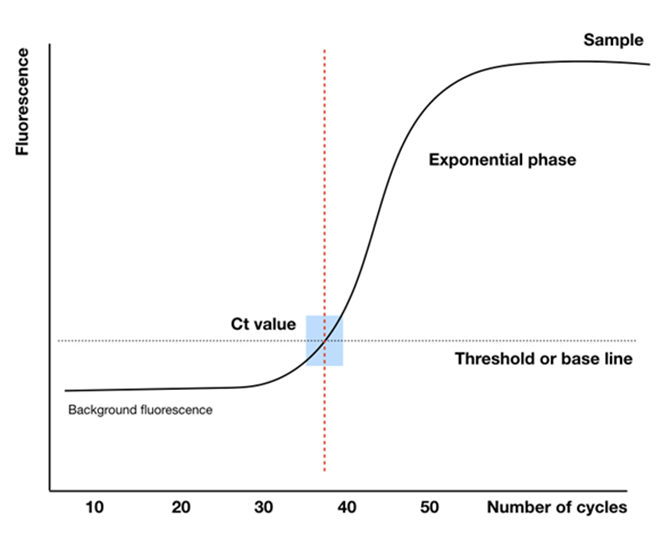
During the Real-time PCR reaction process, the intensity of the fluorescence signal obtained will be converted into a graphical plot. This plot will include parameters such as background signal, baseline, and cycle threshold (Ct) (Figure 3) as mentioned bellow:
– Background signal: refers to the fluorescence signals generated that are unrelated to the real-time PCR reaction. This signal is typically emitted by the reporter end of the probe. Under normal conditions, the quencher is supposed to absorb all of the signal emitted by the reporter, but in reality, the quencher cannot absorb 100% of the signal, so background signal is often present in most real-time PCR reactions. Additionally, the background signal can vary depending on the type of probe and the manufacturer. Nowadays, probe manufacturers have designed various methods to minimize this background signal, such as using dual quenchers. In the case of SYBR Green, in the absence of a target sequence, this dye still fluoresces in the solution, but since it is evenly dispersed, the intensity is weak, leading to background signal for the reaction. In the early cycles of real-time PCR, the initial concentration of the sample is low, so the fluorescence intensity is not sufficient for the real-time PCR machine to detect, and during this phase, only the background signal of the sample is typically recorded.
– Baseline: is the curve representing the signal level during the early cycles of real-time PCR. Establishing the baseline is a crucial step in analyzing real-time PCR results because the baseline is not fixed (it can be adjusted), and the baseline value greatly influences the confirmation of the sample’s properties. If the baseline value is set too low, there is a high chance of detecting noise signals (false positives). On the other hand, if the baseline value is too high, the accuracy of the results will be compromised due to overlooking weak positive samples (false negatives). Therefore, the baseline value should be adjusted to approximately 5% of the highest fluorescence signal value of the sample (as recommended by the manufacturer).
– Threshold: is the signal level at which a statistically significant increase in signal is observed, helping to distinguish the amplified signal from the background signal. Typically, the threshold value is set based on the baseline or the actual signal level of the sample. The method for setting the threshold value is similar to that for establishing the baseline.
– Ct – Threshold cycle: is the number of cycles at which the fluorescence signal of the reaction surpasses the threshold line, changing from negative (undetectable) to positive (detectable). The cycle threshold (Ct) value reflects the amount of the target gene in the early stage of the reaction and is inversely proportional to the initial relative expression level of the target gene. A smaller Ct value indicates a higher initial concentration of the target gene, and vice versa.
– Passive reference dyes: is commonly used in Real-time PCR to standardize the fluorescence signal of the reporter and to adjust for fluctuations in non-PCR-generated fluorescence signals between wells. Not all machines have this feature, so it is important to carefully check the machine's specifications to choose the appropriate reagents.
(https://geneeticeducation.co.in)
6. Result Analysis
In addition to qualitatively detecting the target agent, the qPCR test is further enhanced by the ability to accurately quantify the amount of target DNA in the sample. This technique requires the construction of a standard curve based on Ct values and known DNA concentrations. The concentration of target DNA is determined using the standard curve, so the parameters of the standard curve must meet specific requirements to ensure the reliability and quality of the qPCR quantitative results.
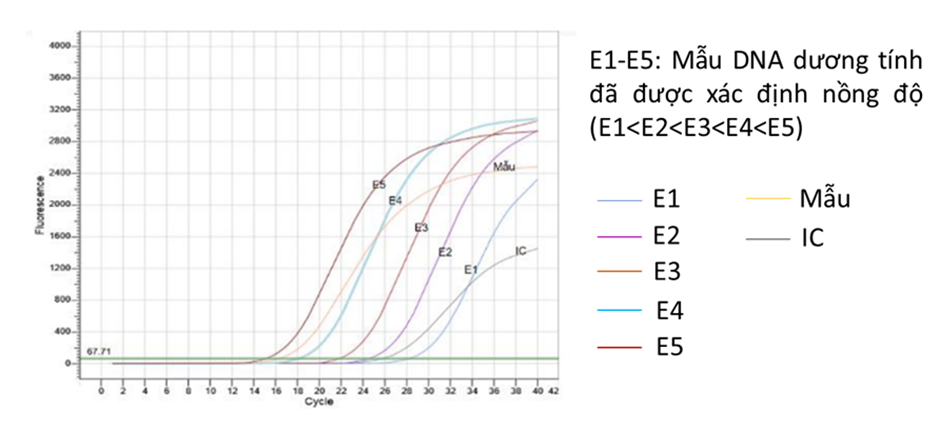
According to the definition, the standard curve is constructed from the cycle threshold (Ct) values of a series of tubes containing DNA with predetermined linear concentrations (typically diluted in 10-fold increments, such as 101, 102, 103, …) (Figure 4). The concentrations selected for constructing the standard curve must cover the expected concentration range of the target DNA in the test sample. The standard curve consists of the x-axis (representing the standard concentration values) and the y-axis (representing the Ct values). The parameters of the standard curve, such as the linear coefficient (R2), amplification efficiency (E%) and slope are calculated by the system based on the actual recorded results, helping to determine the quality of a qPCR reaction. In which:
– The linear coefficient (R2): phản ánh mức độ tuyến tính của các giá trị trong đường chuẩn, R2 lý tưởng là tiến đến 1, thực tế giá trị tối đa chỉ tới mức 0,999.
– E%: reflects how effective the amplification reaction is. An ideal E% is 100%, which occurs when the target DNA doubles after each thermal cycle in the exponential phase of the reaction. However, in practice, the amplification efficiency will deviate from the ideal value, typically ranging between 90-110%. If E is low, it could indicate poor primer sensitivity or inhibition of the reaction, while a high E suggests that the primers are binding specifically. Factors such as the target gene length, GC content, secondary structures formed, and the operator’s handling can affect E%. In research, the handling of the dilution of standard samples can also influence efficiency. For example, when diluting the standard sample from high to low concentrations, the previous high-concentration sample might stick to the tip, leading to higher-than-expected DNA levels in the subsequent diluted tubes, potentially resulting in an E% greater than 100%. Conversely, if the solution is not fully expelled, the E value will be lower.
– Slope: a measure of the amplification efficiency. In other words, the standard curve is built with standard samples spaced by a dilution factor of 10, and the amplification efficiency (E) is calculated using the formula 10^(-1/slope), where the slope represents the steepness of the standard curve. For an ideal efficiency, the product of amplification doubles compared to the original template, so 10^(-1/slope) = 2, meaning the ideal slope is -3.32, corresponding to E = 100%. However, it is difficult to achieve such conditions in practice, so the slope typically fluctuates between -3.58 and -3.10.
After the reaction, based on the equation y = ax + b of the standard curve, the concentration of the target DNA in the sample can be determined (Figure 34). Thus, the standard curve is a parameter used to determine the copy number of DNA in the sample and evaluate the amplification efficiency. Currently, some qPCR kits on the market provide pre-prepared standard concentration tubes to ensure accurate standard curve construction, minimizing the influence of user handling.
7. Analysis of HBV Quantification Results
Detection and quantification of HBV agents in serum samples using the ABT® DNA QUANTITATIVE PCR KIT (SQH-001) with Real-time PCR LineGene 9600.
7.1. Qualitative Analysis
Analysis of the results for each sample (determining whether the sample is positive, negative, or inconclusive
- Fluorescent signal detected in the FAM channel => Positive sample: the sample contains HBV-DNA. In this case, the signal in the HEX channel may be normal or low because when the HBV-DNA concentration is high (positive signal in the FAM channel), it may lead to a decrease or absence of fluorescent signal for the internal control in the HEX channel (competition).
- No signal detected in the FAM channel and the internal control signal is present in the HEX channel. No HBV-DNA is detected in the sample: the sample is considered negative.
- No signal detected in both the FAM and HEX channels: the result cannot be concluded.
Analysis of results in some real cases:
– Case 1: The result is HBV positive because fluorescent signals were detected in both the FAM and HEX channels.
– Case 2: The result is HBV negative because fluorescent signals were only detected in the HEX channel, with no signal detected in the FAM channel.
7.2. Quantitative Analysis
Analysis of calibration curve results:
– Correlation value reflects the linearity of the calibration curve. Ideally, the correlation should be 1, although 0.999 is typically the maximum value achievable.
– Efficiency (E) should be 100%, meaning the sample doubles after each thermal cycle during the exponential amplification process. A good reaction will have an efficiency value (E) between 90% and 110%.
– Slope is a measure of the reaction efficiency. To obtain accurate and repeatable results, the reactions should have an efficiency as close to 100% as possible, corresponding to a slope close to -3.32.
Enter the recorded results from the software into the Data File.
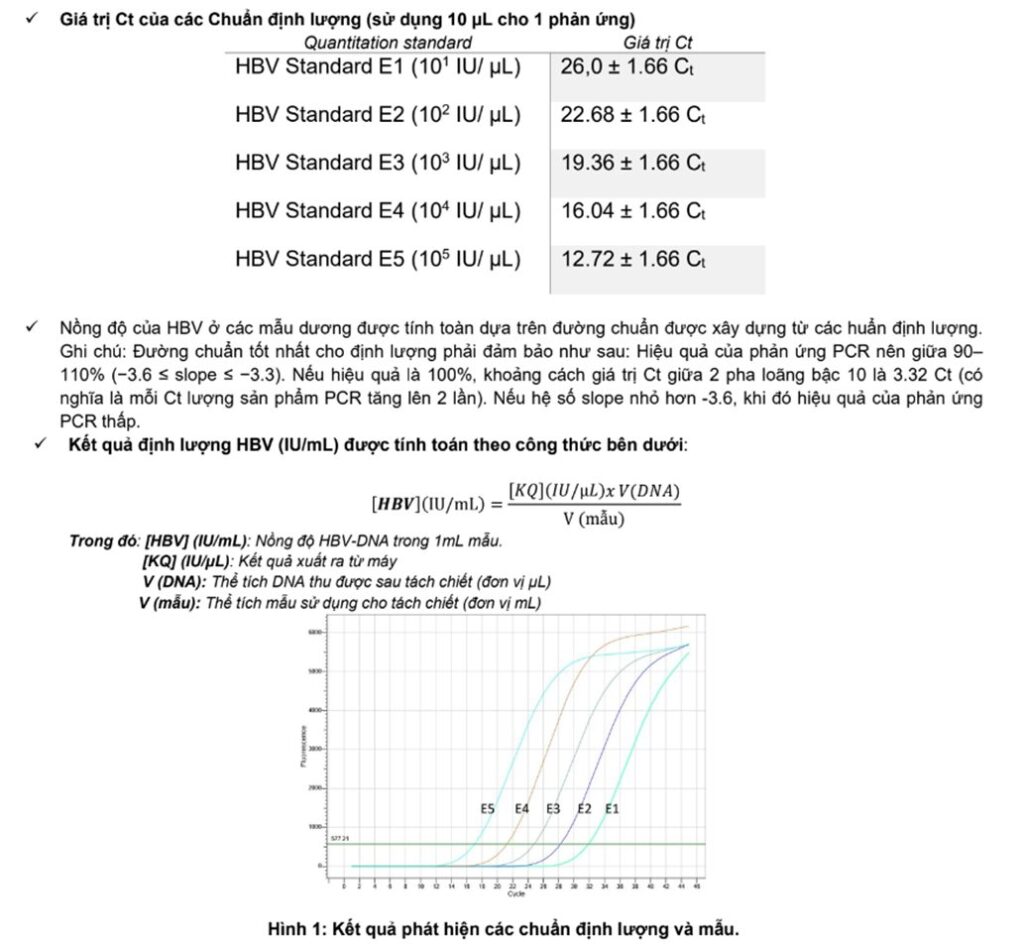
- The concentration of HBV in positive samples is calculated according to the instructions provided in the HBV quantification kit manual, as ABT® DNA QUANTITATIVE PCR KIT (SQH-001)
HBV standard curve:
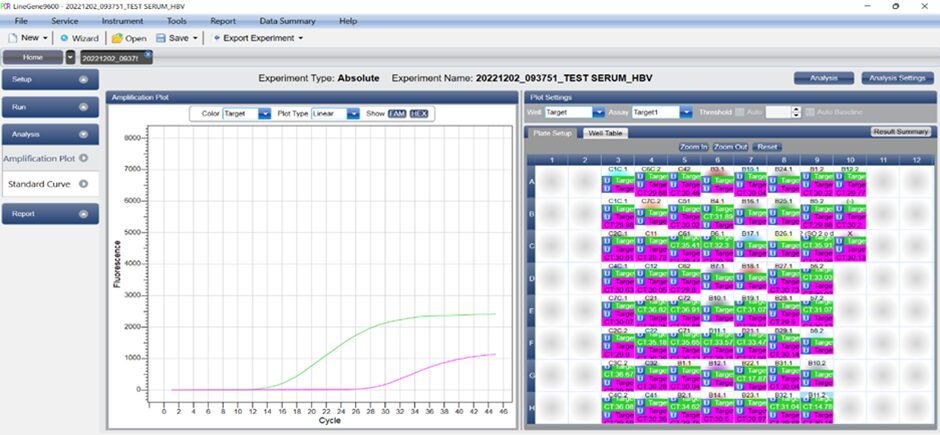
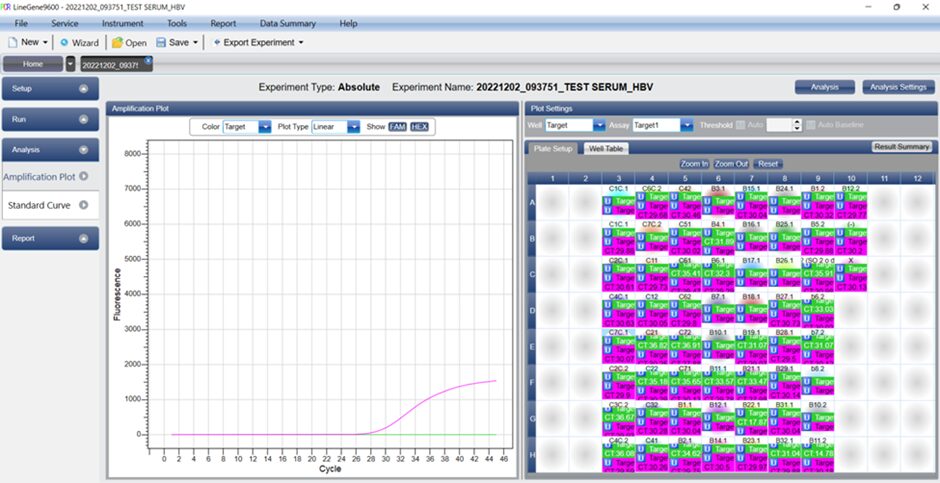
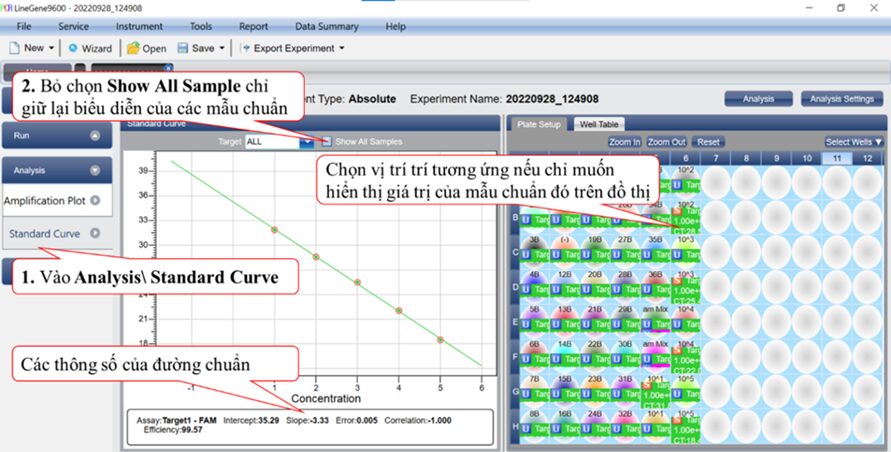
To create a standard curve on the Real-time PCR device, all 5 quantification standard samples should be used and entered into the machine in 'standard' mode with known concentrations (Figure 8).
After constructing the standard curve using the software that accompanies the machine, proceed to read the sample results, which are exported to an Excel file (Figure 9).
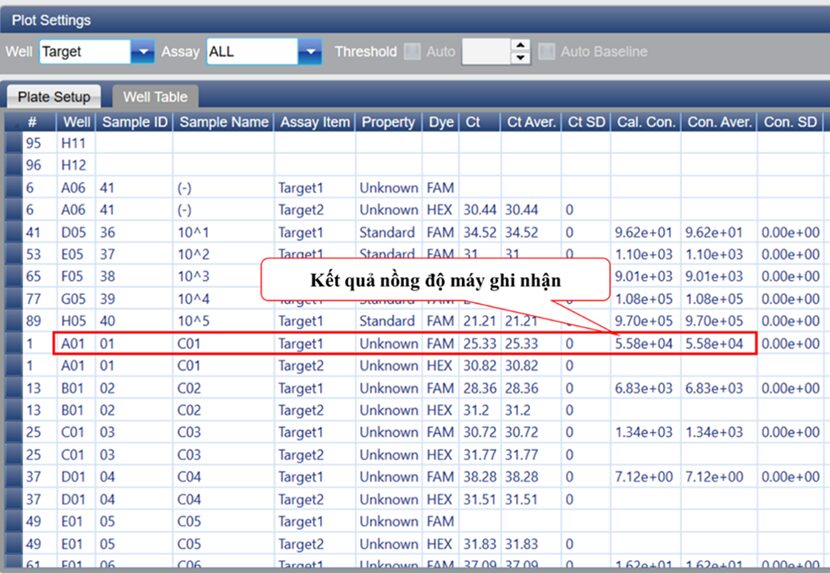
Với 0,2 mL mẫu huyết thanh sau khi tách chiết nucleic acid tinh sạch được hòa trong dung dịch rửa giải thu được thể tích 50 μL, sau khi thực hiện phản ứng qPCR một bước kết quả nồng độ ghi nhận từ máy là 5,58 × 10⁴ (5.58e+4) (IU/µL) (Figure 9), applied the formula:
[HBV](IU/mL) = (5,58.104 (IU/μL) x 50 (μL))/0,2 mL = 1,4 × 10⁷ (IU/mL)
In conclusion, ABT® DNA Quantitative PCR kit is used to detect and quantify the presence of HBV-DNA in serum/plasma samples using real-time PCR technology, with an analytical sensitivity of 28 IU/mL.
8. References
1. Higuchi, R., Fockler, C., Dollinger, G., & Watson, R. (1993). Kinetic PCR analysis: real-time monitoring of DNA amplification reactions. Bio/technology, 11(9), 1026-1030.
2. Bustin, S. A. (2002). Quantification of mRNA using real-time reverse transcription PCR (RT-PCR): trends and problems. Journal of molecular endocrinology, 29(1), 23-39.
3. Ponchel, F., Toomes, C., Bransfield, K., Leong, F. T., Douglas, S. H., Field, S. L., … & Markham, A. F. (2003). Real-time PCR based on SYBR-Green I fluorescence: an alternative to the TaqMan assay for a relative quantification of gene rearrangements, gene amplifications and micro gene deletions. BMC biotechnology, 3, 1-13.